What I’ve Done With Salesforce

I work with Salesforce often. Salesforce is a popular CRM (customer-relationship management) software. In my day job at IHS, we use it to track our fundraising efforts. We also use it to track our programs and opportunities in higher education.

For a period, I focused my role at IHS on standard Salesforce administrative tasks. This includes user access, database structure, and workflow automation.

This work is important. A database is doomed to failure without a wise admin. I strive to go beyond the basics to deliver the best possible outcome. Here are a few examples of how I have do that:

List matching. At IHS, we send staff members to academic conferences to meet potential academic partners. When we have conference registration lists in advance, I run a query of our Salesforce database to see who we already know. This allows our team to reach out in advance, leading to maximizing the value of their time spent attending the conference.

Automated metrics. When I joined IHS, we were paying a vendor to track our social media performance metrics. This vendor logged into our accounts and entered this information into a form which stored the data in Salesforce. I built a tool that does this automatically by connecting to the relevant APIs (Google Analytics, Youtube, Facebook, Twitter, etc.) This saved the organization money on the vendor and ensured the data was in Salesforce in real-time.

Connected Salesforce to WordPress and Workplace. This meant that when a client clicked a button that fit their existing Salesforce workflow, accounts were automatically created on their WordPress website and Workplace by Facebook platform. This automation reduces manhours spent on creating and deleting these accounts.

Pushed Pardot email metrics to Salesforce. Pardot is a marketing automation tool sold by Salesforce inc for integration with the Salesforce database. I’m not sure why, but there is no out-of-the-box way to see Pardot email performance metrics within Salesforce. I built an integration automation that accomplishes this by creating Salesforce records with performance metrics for each Pardot email.

Built Pardot lists using custom Salesforce fields. Pardot’s main selling point is Salesforce integration, but we found at IHS that we could not create lists based on a custom field for the Campaign Member object. I figured out how to do this with a Python script, which I wrote about here. This saved our staff time they were spending manually exporting lists from Salesforce and uploading into Pardot.

Built a Youtube integration. Last but not least, I have built a direction integration between Salesforce and Youtube for performance metrics. This allows you to connect your Salesforce database to a Youtube channel, create records for each of your videos, and sync performance metrics. I’m working towards selling this as a Salesforce AppExchange app.

Future of Sports Commentary

Last night I tuned in to a great NBA matchup, the Milwaukee Bucks against the Boston Celtics. I watched the broadcast on TNT but my TV was muted. Instead, I had my tablet open as two guys on their couch did commentary for the game.

I think this is the future of sports coverage.

Danny LeRoux and Nate Duncan, broadcasting from their couch

Well maybe not exactly those two guys on their couch. But I think we will see more options for consumers. Last night I tuned in to the “#NBACast” show by Nate Duncan and Danny LeRoux. They also run my favorite NBA podcast Dunc’d On.

There are two categories of NBA games, national broadcasts and local broadcasts. National broadcasts are those on networks like ESPN, TNT, or ABC. There is one neutral commentating crew. Local broadcasts have two separate broadcasts of the game by each team’s crew. League Pass subscribers like me can still tune in to these. 

The announcers for national broadcasts are unbiased and more ‘prestigious’ in their field. As a pretty extreme NBA fan I find their commentary bland. Some announcers like Jeff Van Gundy often go on rants unrelated to the game they are announcing. This actually makes some sense. The average NBA fan follows their team and probably tunes in to one national broadcast a week. That game is their weekly lens into the NBA at large so they actually find some value in Van Gundy complaining about LeBron’s defense during a Toronto / Philadelphia game.

But it drives me crazy when I’m trying to watch a game and the announcers are on a completely unrelated rant. I know I’m not alone. Cue the “#NBACast”. It fits my style because they approach the game from an analytics mindset. They also take viewer questions using the chat feature of their online broadcast. 

Anyone can tune in to this show for free but you can subscribe to their Patreon to financially support them. I have been contributing $7 per month for a few years now. Between their show and podcast, I get well over 21 hours of content a month. I get more than $0.33 per hour of new NBA information. I particularly enjoy their summaries of games I missed (especially West Coast games that happen on weeknights) and their “15 in 60” segments throughout the season where they quickly run through the status of each team.

Duncan and LeRoux certainly aren’t perfect. Lots of people can’t stand their style and even as a big fan I have some complaints with them. But I enjoy having the opportunity to tune in to their commentary of an NBA game instead of listening to Reggie Miller or Mark Jackson. I hope we all get more options for how we consume our content.

Update on NBA Game Log

Now that the NBA season is underway, I am using the NBA game log tool I built. This allows me to track the games I watch and the notes I take. I’m primarily interested in tracking how much I have watched of each team so I can keep an eye on the entire league.

This idea was included in my previous projects post. Last season I tracked the games I watched in a spreadsheet. So far this app is easier to use, especially for looking at the data as a whole, and adds the capability of logging notes. 

I built this app using the Javascript MEAN stack: MongoDB, Express.js, Angular, and Node.js. This was my most ambitious Javascript project to date. I have learned a lot, especially regarding API design. I’m proud of what I have built so far but have more I would like to do such as:

  • Better design and interface
  • Password reset for users
  • Different analysis dashboards, such as for a particular team or player
  • Customizable sharing options for different users

Anyone can create an account and use the app but I mostly built it for my NBA viewing and for my Javascript experience. 

Predicting the 2018-19 NBA Season

Just in time for the NBA season to kick off tomorrow, I have projected win totals for each team. Below you will find my predictions for each team alongside latest Vegas odds. I’ve also included the difference between my predictions and the Vegas line, as well as the absolute value of the differences. Below the tables you’ll find my team by team thoughts. Here’s to hoping I do better than last season, with a median difference between prediction and actual wins of 6.

Western Conference

  1. Golden State Warriors (55) I’m nervous with how low this prediction is, but there are two important factors to consider. First, the West is going to be a bloodbath this season. Only the Kings are outright terrible. Second, we have seen this team prioritize the postseason which makes sense given the injury history of stars like Curry and Durant.
  2. Houston Rockets (53) Their roster got a bit weaker. Also, last year they were gunning to show their dominance and win Harden an MVP. This year, look for them to also prioritize postseason health.
  3. Utah Jazz (49) The Jazz looked great last postseason and sophomore guard Donovan Mitchell should only improve. 
  4. San Antonio Spurs (48) Yes, I factored in Dejounte Murray’s season-ending injury. The question for the Spurs is what can they get out of DeMar DeRozan? 
  5. Oklahoma City Thunder (47) Simply getting rid of Carmelo should be a net positive for the Thunder. However, they have a few reasons for concern. First, Russell Westbrook relies heavily on athleticism but is turning 30 next month. Second, Andre Roberson has apparently suffered a setback in his injury recovery. Having Roberson on the court is essential to their defense which is essential to the Thunder being an elite team. 
  6. Minnesota Timberwolves (45) I took Jimmy Butler off the Timberwolves but I did not put him on another team, which will almost certainly create problems at season’s end. I also gave Wiggins a small boost to his production in the season before Butler came to Minnesota.
  7. Denver Nuggets (44) This is a nice young team with plenty of players poised to improve: Nikola Jokic, Jamal Murray, Gary Harris. Having Paul Millsap back from injury will be a nice boost to possibly get them into the playoffs this year. If Jokic does not improve on defense, they could be in trouble.
  8. New Orleans Pelicans (43) The Pelicans looked phenomenal in the playoffs against the Trailblazers. They are basically bringing back that squad with an added Julius Randle, who should be a great addition.
  9. Los Angeles Lakers (42) Yes, right now I have a LeBron team missing the playoffs. By a game.  I could see them as high as fourth if you look at how tight these win projections are. I think we’re all curious how this team will look given how differently they are built than the LeBron Cavaliers. I think their recent pickups of Rajon Rondo, Lance Stephenson, and Javale McGee are suspect.
  10. Portland Trailblazers (41) I think Damian Lillard had a phenomenal season but it was also a career year. Look for him to regress a bit without any strong steps forward from the rest of this squad.
  11. Dallas Mavericks (38) Luca Doncic is going to be an NBA star, but this team is a few years away from competing. 
  12. Los Angeles Clippers (34) I’m still not sure how the Clippers performed as well as did last season and it’s possible I’m missing something here. But I don’t think this team is quite good enough to compete in an excellent Western Conference. 
  13. Memphis Grizzlies (33) The Grizzlies seem to think they’ll be competitive with Mike Conley and Marc Gasol healthy but I’m not so sure. My money is on this team struggling and then the front office breaks things up.
  14. Phoenix Suns (26) Another team operating under delusions of grandeur, they have some nice young players but will struggle for a few more seasons. Look for them to shoot themselves in the foot by making an ill-advised trade for a veteran point guard.
  15. Sacramento Kings (25) The Kings are bad. Marvin Bagley might be a good NBA player but I doubt he’ll be better than Doncic.

Eastern Conference

  1. Toronto Raptors (62) Take a 59 win team, swap out DeMar DeRozan for Kawhi Leonard, and remove LeBron from the conference. That sounds like 3 more wins to me. If Leonard’s injury is not resolved this won’t happen, but all signs indicate he will be ready to go this week. 
  2. Boston Celtics (55) One of my biggest problems last season was accurately predicting the performance of young players improving their skills. I attempted to tackle that with these young Celtics stars but I will not be shocked if they outperform this projection.
  3. Philadelphia 76ers (54) See my above comment given the number of young stars in Philadelphia. I’m not expecting great things from Markelle Fultz although I think he’ll be a positive contributor. It’s always fair to question the health of Joel Embiid, too.
  4. Indiana Pacers (51) So long as Victor Oladipo doesn’t serously regress, this team should be real good. Tyreke Evans is a great addition for them.
  5. Milwaukee Bucks (50) I am really struggling with how to appropriately factor in the huge coaching upgrade from Jason Kidd to Mike Budenholzer. Based on preseason games, which we should take with a grain of salt, Giannis Antetokounmpo looks like a leading MVP candidate.
  6. Washington Wizards (48) If there is one thing I feel confident predicting, it is that the Wizards will have locker room troubles. We have seen it before from teams lead by John Wall and it is basically guarantee when Dwight Howard comes to town. I’m curious to see how Thomas Satoransky compared to last year as a fill-in starter when Wall was injured. 
  7. Miami Heat (43) I am tempted to project the Heat trading for Jimmy Butler but that’s not looking like a done deal. The Heat look stuck in just-above-mediocrity. They have lots of good players, but not a single very good one. 
  8. Brooklyn Nets (39) I am feeling a bit uneasy about how I have the Nets. But it’s worth considering how most analysts love the Nets style, particularly their shooting profile, they just have lacked the talent to date. In a weak Eastern Conference, they have a chance to be competitive. 
  9. Detroit Pistons (35) Andre Drummond and Blake Griffin looked surprisingly good on the court together. But its still not a very effective roster makeup and they’re going to struggle to score. I’m not giving a boost for regular season master coach Dwayne Casey, who could push them at least into the playoffs.
  10. Charlotte Hornets (35) I want to see Kemba Walker on a roster where the second best player is better than Jeremy Lamb! 
  11. Cleveland Cavaliers (30) I don’t see how Kevin Love is a successful first option in today’s NBA. Minnesota Kevin Love was bigger and able to bully guys around in the post. After getting into shape to be a corner 3 threat for LeBron, this is going to be a rough adjustment. They also like a decent point guard which has a multiplying negative effect.
  12. Orlando Magic (27) The Magic are struggling. Who will win games for them? D.J. Augustin? Nikola Vucevic? They’ve got Aaron Gordon I guess. Oh and this factors in Mo Bamba as a decent rookie.
  13. Chicago Bulls (27) The Bulls have some reasons for optimism, just a few years into the future. They have made a number of poor decisions recently, such as picking up Jabari Parker and signing Zach Lavine for too much money.
  14. New York Knicks (27) I would have them a bit higher if Kristaps Porzingis was healthy. Until then, they’ll be relying on Enes Kanter (who looked surprisingly good last season) and Tim Hardaway Jr. Just not good enough. 
  15. Atlanta Hawks (25) Trae Young will likely have a handful of games where he goes crazy but for the most part he will struggle. I have John Collins and Alex Len as their best players. Yeah, they are going to be bad.

Analytics

One challenge I face in working in analytics is people commonly misunderstand analytics. It seems to stem from a misunderstanding of what data is.

Data is just information.

When you think of data, you probably think of numbers. Lots and lots of numbers, maybe in a spreadsheet. And when you think of analytics, I’m guessing you think of complicated equations and graphs.

That’s a good start, but it is a very incomplete picture. Data, or information, comes in many shapes and sizes.

Analytics, in my mind, is simply the use of data to answer questions.

In basketball, there are often debates between the analytics approach and the eye test approach. The analytics approach focuses on how a player looks on the stats sheet: shooting percentage or effective field goal percentage. The eye test approach focuses on how a player looks on the court: their skill set or confidence.

I think the eye test is just one form of analytics. And the observations an analyst or fan makes (how is the player with the ball in their hands? how is their court vision? how is their shooting form?) are data.

And yet, most people distinguish between “analytics” and common analytical practices like the eye test. Why?

There are two elements that come to my mind about what distinguishes “analytics”:

  • Focus on the questions to be answered
  • Standardized data
Does the eye test include these factors? Well, not usually. So maybe I’m overselling it to say that’s analytics. But I think it certainly can be. 
One of the most important books in the analytics realm is How to Measure Anything. It is a classic resource for advice on how to measure the, well, seemingly unmeasureable. 

The eye test has a high degree of subjectivity. Different observers will have different and biased observations even of the same player. But there are a number of steps you can take, such as a grading rubric or a peer review system, to standardize the observation data. 
When it comes to focusing on the questions to be answered, you might need to use different systems for answering different questions. How you compare two basketball players of the same age at the same position may differ from how you compare two basketball players at different positions. Or two players from different eras. But you will need some clear system for standardizing and comparing your data. 
I’m using examples from basketball because I spend a lot of time thinking about basketball analytics and it’s a more accessible example than most examples from my job. But I encounter a lot of this at work as well. My colleagues will think that the analytics team is separate from their work. 
A successful analytics team needs to seek out their colleagues’ own “eye tests” and incorporate that data for value-producing organization-wide analytics. 

Moneyball

If you’re wondering where I got my love for sports analytics, the answer is Moneyball. Published in 2003, Moneyball explains Sabermetrics through the story of Oakland Athletics General Manager Billy Beane. As defined by Wikipedia, Sabermetrics is the empirical analysis of baseball, especially baseball statistics that measure in-game activity“.

Moneyball generated a lot of controversy. These stats nerds were ruining the game with complicated algorithms. At the time, Beane thought players who excelled in on-base percentage were undervalued compared to those with a high batting average. Old school analysts like Joe Morgan mocked those who valued on-base percentage for wanting to clog up the basepaths.

The Oakland Athletics haven’t come within a 10-foot pole of a World Series. Why is Moneyball so lauded?

I evaluated whether on-base percentage is a better statistic than batting average. If you think that’s a poor way to evaluate the value of Sabermetrics, I agree. But it is probably the most popularized insight from Moneyball and makes for a simple test.

Using MLB data from 2003 to 2018, I calculated a multiple linear regression between batting average, on-base percentage, and wins. Here was the result:

Wins = (OBP * 560) – (BA * 204) – 49

This means to estimate how many games a team will win, you multiply their on-base percentage by 560, subtract their batting average multiplied by 204, and subtract 49. After controlling for OBP, having a higher BA is associated with a smaller chance of winning.

How could this be? Hits make you less likely to win? Not exactly. On-base percentage includes hits, walks, and hits by pitch. Since batting average includes hits, on-base percentage captures everything captured by batting average and then some.

To confirm this, I calculated two simple linear regressions, that between on-base percentage & winning and that between batting average & winning.

Wins = (OBP * 409) – 52
Mean Squared Error = 98

Wins = (BA * 340) – 7
Mean Squared Error = 113

First, we see the coefficient is stronger for on-base percentage than for batting average, 409 compared to 340. Second, we see the mean squared error is smaller for on-base percentage meaning the relationship is clearer. Conceptually, on-base percentage is more valuable to me than batting average. But if you’re skeptical and wanted the data, there it is.

The debate between on-base percentage and batting average is only one example between the statistics nerds and the old guard. Over a decade after Moneyball was published, on-base percentage is now properly valued. The promise of using statistics and economics to recognize undervalued assets in sports remains as alluring as ever.

Thanks to Kyle Safran for helping me prepare this post.

Revisiting 2017-2018 NBA Predictions

Around this time last year, I attempted to predict how many games each NBA team would win. I am hoping to do the same this year but before I do so I want to evaluate my predictions from last year. My model was primarily built using previous season win shares. One consistent flaw I found in my predictions was that I tended to underestimate the performance of team with promising young players. This makes sense because young players have the greatest potential to improve. A few other big misses were due to injuries, especially teams that choose to tank* after a star player was injured.

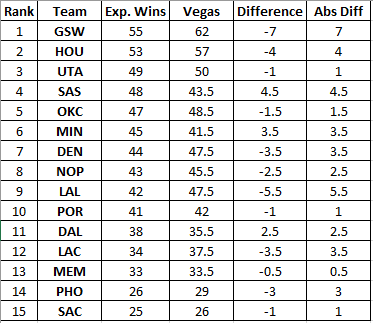
The number after each team is how the team fared compared to my prediction. For example, the Golden State Warriors won 9 fewer games than I predicted, 58 as compared to 67.

Golden State Warriors (-9) I don’t feel too bad about missing on this one. I think the Warriors could have won a handful more games, but they took their foot off the gas pedal to prioritize the playoffs. Given how the Rockets won more games but Chris Paul got hurt in the Western Conference finals, I can’t criticize that strategy.

Cleveland Cavaliers (-12) This prediction looks awful in retrospect. I did not expect much drop off from Isaiah Thomas but that was clearly a mistake. Not only did he miss much of the season recovering from injury, when he did return he was a much worse player. 

Minnesota Timberwolves (-13) I noted at the time this was probably showing a flaw in my model and I think that’s clear as day now. Andrew Wiggins regressed, which is a worrying sign that he played worse alongside Jimmy Butler. While Jeff Teague had a worse season than I expected, I think that was on me more than Teague. His year with Indiana the season before was clearly an aberration. For veteran players, my model could be improved by moving to a multi-year win shares average.

Houston Rockets (+2) Their big move was adding Chris Paul and he added about as much value as I expected. The question was would Harden & Paul be able to coexist without dropping off and it looks like they actually improved their individual production a bit. I wonder how much of this is due to their strategy of successfully playing lots of isolation basketball.

Oklahoma City Thunder (-5) This was an alright prediction. I thought it was the Knicks holding Carmelo back over the past few years, but he was a net negative even on the Thunder. I expect the Thunder to be a few games better with him off the roster this year.

San Antonio Spurs (-3) While my prediction looks close here, I’m shocked. My prediction certainly did not account for Kawhi Leonard missing most of the season. Where did they make up the production? A better season for LaMarcus Aldridge as well as a breakout year for Kyle Anderson. It also helps they continue to be the Spurs and put out the 3rd best defense in the league.

Washington Wizards (-5) I initially guessed I overestimated wins for the Wizards due to John Wall’s injury but they played fine without him. It was actually Marcin Gortat who under performed most severely and Bradley Beal was a bit worse than I expected.

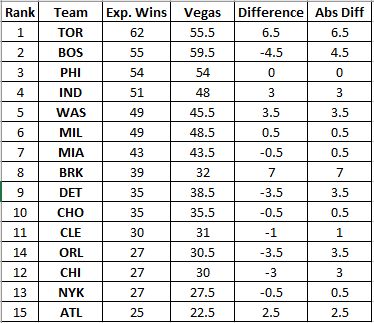
Toronto Raptors (+11) One of many underestimates where I did not properly account for strong contributions from young players. For the Raptors that was Jakob Poeltl, Pascal Siakam, and Fred VanVleet.

Boston Celtics (+7) The accuracy of my prediction here is similar to the Raptors (underestimated young talent) and the Spurs (worse than it looks considering Gordon Hayward was hurt all season). The young players I underestimated the most were Jayson Tatum, Terry Rozier, and Jaylen Brown. Look for those players to get even better next year and they’ll add Hayward back in.

Denver Nuggets (-1) Nearly perfect!

Utah Jazz (+5) The main variable I missed here was Donovan Mitchell. I expected him to be your average rookie guard which is a slight negative but he was phenomenal for Utah.

Charlotte Hornets (-7) Dwight Howard was a disaster for the Hornets. I’ll need to keep an eye out for players who put up big stats in bad situations, like Howard did in the previous season.

Miami Heat (+1) Nearly perfect!

New Orleans Pelicans (+6) Two things happened here. First, the pairing of Anthony Davis and DeMarcus Cousins worked out better than I expected (and the Pelicans’ pickup of Nikola Mirotic when Cousins tore his Achilles tendon worked out nicely). Second, I did not factor in Jrue Holiday missing most of the previous season and he had a great bounce back year.

Milwaukee Bucks (+3) I had high expectations for Giannis Antetokounmpo which he met, but it was the mid-season trade for Eric Bledsoe that improved this team beyond my expectations. 

Los Angeles Clippers (+4) There was no clear pattern to my under estimation here. As far as I can tell, Doc Rivers did a fine job coaching this team and getting a little bit more than expected out of each player.

New York Knicks (-8) The Knicks were exactly on pace to win my predicted 37 games until star Kristaps Porzingis tore his ACL on February 6th. After that, the Knicks accepted their fate and attempted to make a late entry into the tankathon.

Dallas Mavericks (-12) While I expected the Mavericks to be a middle of the road team, instead they embraced tanking to the fullest extent. This made it easy to play a rookie at point guard, always a losing option, and to not be too torn over the loss to injury of Seth Curry. 

Philadelphia 76ers (+17) This was my worst prediction (Chris Freiman if you’re reading this, you were right!) They had a few things going for them. First, Ben Simmons was a massive value-add player for them when merely being positive is an accomplishment for a rookie. Second, Joel Embiid played many more games than I expected. Third, some other young players like Dario Saric and Robert Covington took nice steps forward. Fourth, in a similar fashion to the Clippers, essentially everybody on this roster had a slightly better season than my model expected. Credit Brett Brown for that one. 

Portland Trailblazers (+14) I thought Evan Turner would be a negative for this team but he was (barely) a positive contributor. I thought Damian Lillard would be really, really good but he was really, really, really good. Ed Davis took a much larger step forward than I expected and Jusuf Nurkic seems to fit in much better in Portland than he did in Denver.

Detroit Pistons (+5) When the Pistons traded for Blake Griffin, it gave them a boost in the short term. They did a little bit better than expected but it still was not enough to make the playoffs. How much will the Griffin trade hurt them in the long term? 

Indiana Pacers (+15) I completely missed on this prediction but so did everybody else watching the NBA. The big story here was Victor Oladipio’s meteoric rise from alright backup in OKC to all-star in Indiana.

Memphis Grizzlies (-10) The Grizzlies’ season was similar to that of the Knicks. When star Mike Conley got hurt early in the season it became clear the team needed to tank. Conley played so few games I can’t really extrapolate based on the time he was healthy.

Orlando Magic (-6) This was a surprise for me: my model had very high expectations for Mo Speights. He had a steep drop off from one of his best seasons ever last year in Los Angeles. The Magic, unsurprisingly, were also tankathon competitors. 

Phoenix Suns (-8) I’m not too upset about missing on a team that won the tankathon, but I will note that trading Eric “I Dont wanna be here” Bledsoe was a significant contributing factor.

Atlanta Hawks (-3) The Hawks were bad, as expected.

Brooklyn Nets (+2) The Nets were bad, as expected.

Sacramento Kings (+2) The Kings were bad, as expected.

Chicago Bulls (+3) The Bulls were bad, as expected.

Los Angeles Lakers (+12) To close out this analysis, I really need to do a better job of projecting youth-heavy teams (see also 76ers, Raptors, Celtics). Kyle Kuzma and Josh Hart were much better than I expected. An interesting note is that I have Julius Randle as their most impactful player last year but they let him leave for New Orleans.
*If you are you are reading this but don’t follow the NBA closely, “tankathon” refers to how many NBA teams “tank” (not sure where the term came from, but it means purposefully put out a poor team to work towards a losing record). So many teams were doing this last season in the hopes of getting a better draft pick that it became a bit of a “tankathon”, a contest to see who could tank the strongest.

Non-Profit Measurement

For-profit companies have it so easy. Maximize revenue, minimize expenses. Make a profit.

There are important steps to making a profit. Develop a product that provides value. Identify customers. Sell customers on your product. Bring in talent and keep them happy.

But at the end of the day, your balance sheet tells you how you are doing. It is not so clear for a non-profit.

I have worked for a few non-profits now. Here is a sample of their mission statements:

…to inspire, educate, and connect future leaders with the economic, ethical, and legal principles of a free society.

…to educate, develop, and empower the next generation of leaders of liberty.

 …to ensure higher education becomes a place where classical liberal ideas are regularly taught, discussed, challenged, and developed, and where free speech, intellectual diversity, and open inquiry flourish.

If you are an organizational leader or a financial supporter, how do you know if a non-profit is successfully advancing such a mission?
This is where non-profit measurement comes in. 
Non-profit measurement is the attempt to measure an organization’s impact. This means attempting to answer questions such as: 
  • What does success look like? 
  • Is our organization moving us closer to success? 
  • How do we know? 
  • If we are working towards long-term results, what short-term indicators can reasonably suggest long-term success?
In my experience, effective measurement provides a common language and clear (if inexact) answers to these questions. These are guidelines to steer team members in making decisions that move the organization in a unified direction. 
If you wonder what I do for a living, I attempt to help the Institute for Humane Studies measure success and make better decisions towards furthering our vision. 

NBA game log tool online!

Last week I wrote about a few projects I want to tackle in my spare time. Friday night I started work on an NBA game log tool. Last night, I successfully deployed my initial app to Heroku! You can check it out here.

The goal of this tool is to easily log and recall notes about NBA teams and players. As I wrote previously, I think the “eye test” of watching games is just as important as studying player statistics. To use the eye test effectively I think you need to keep notes as systematized as possible.

When you log in, you see all existing notes. You can add an entry for a game you watched which includes the teams playing, the date, how much of the game you watched, and your notes on the game. Log entries can be edited or deleted. There is also a functioning registration and login system for users.

I have a long list of features to keep adding, here are my top priorities:

  1. Differentiate notes of different users
  2. Search notes for a specific team
  3. Associate notes with specific players
  4. Better visual layout
  5. Possibly, related Android and iOS apps
  6. A snappier name (NBAeyeTest?)
For now, I’m thrilled to say this project is already online! This is my most successful javascript project to date. I built this app using the MEAN stack: MongoDB, Express, Angular, and Node. This is also my first time using Heroku. 
Again, if you are interested, please check it out here. I’m aware of a few bugs, in particular the footer doesn’t always load properly. Please let me know what other bugs you run into! 

Projects

Here are some projects I’m currently working on and/or thinking about kickstarting:
A computer version of the Parker Brothers World Flag Game About The United Nations. This is a classic game for the Needham family, especially at our cottage. I’m working on this game as a chance to practice the Angular framework and possibly the full MEAN stack. I wanted to use a board game that, as far as I know, has not been digitized before.

An NBA game log tool. I watch a lot of the NBA and I try to go beyond watching solely the best teams. Two seasons ago I used a Google Sheet to track what games I watched to ensure I was getting a decent spread of all 30 teams. I want to make a tool to easily log which games I watch, how much of a game I watch, and my notes on what I observe. Additional features would include tagging and looking up notes based on individual players as well as a login system for multiple users. My instinct is to make this with the Flask Python framework.

An NBA lineup quick view tool. The official NBA website has a great tool for analyzing different lineups. I want to make a handy reference where people can quickly see the best and worst lineups in the league and for each team on the basis of offensive success, defensive success, and net success. You could in theory do this with the NBA.com site, but it requires a number of steps. I want to create a website that has this data already prepared for you. This would likely be a Flask project as well.

Reach out to Scott Sumner and discuss building a cryptocurrency linked to NGDP as he proposed here. The step I need to take between here and now is building a just-for-fun cryptocurrency as proof of competency.

Calculate which NBA player had the highest game score against each NBA team last season. I did this for the 2016-2017 season.
Track how accurate Pythagorean win projections were throughout the previous NBA season. This was my original goal in starting a weekly NBA blog. I have the data ready to analyze, I just haven’t followed through on it yet!

If you read this post and are interested in collaborating on any of these projects, email me